https://x.com/cexscan/status/1869643905706131784

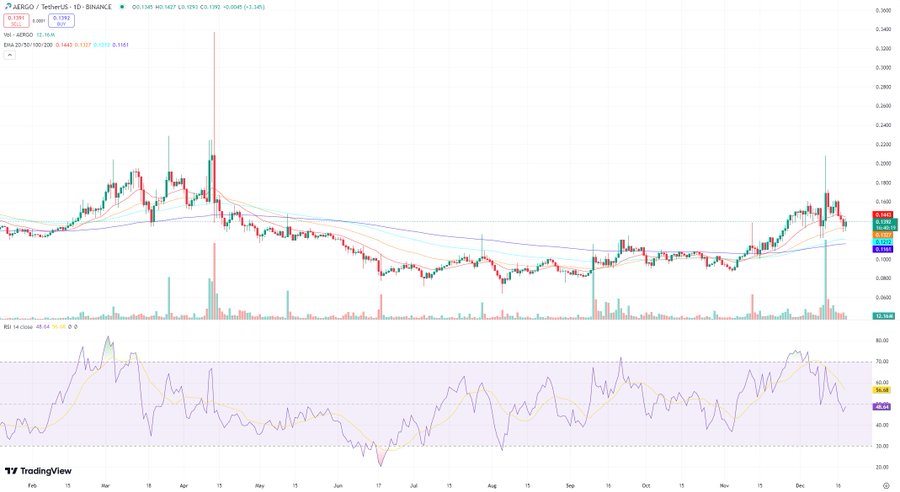
$AERGO/USDT Technical Analysis Overall Trend: The overall trend for AERGO/USDT appears to be bearish, despite recent minor rallies. The 20, 50, 100, and 200-day exponential moving averages (EMAs) are all declining, and the current price is trading below all these moving averages, indicating a negative trend. Candle patterns show periods of consolidation and downward pressure, aligning with the bearish EMA formations. No definitive “golden cross” or “death cross” is evident presently, but the trend line suggests a further bearish continuation.
Key Support and Resistance Levels: Support is likely around the 0.1161-0.1212 range, based on prior price action and significant upward movement which appears to have found a ceiling. Resistance levels are notably evident at 0.1327 and 0.1443, with the current price consolidating around these areas, hinting at potential rejection points. Further resistance levels could be above 0.1500, reflecting prior peaks.
Volume Analysis: Volume patterns suggest a lack of assertive buying pressure to support significant price rallies. High volume candlesticks are generally associated with sharp declines. Low trading volume accompanies periods of consolidation, which could imply indecision or a lack of conviction in the market by investors. There’s a need to watch for higher volume during potential breakouts to validate any trend reversals.
RSI and EMA Analysis: The RSI (Relative Strength Index) is currently slightly above 50, indicating neither extreme overbought or oversold conditions. There are no significant divergences between price and RSI that strongly contradict the bearish EMA trend.
Candlestick Patterns: Some potential reversal patterns are visible, but these are insufficient to fully counteract the broader downtrend. Hammer or doji patterns would need higher volume, and no significant support or resistance breach at their point of occurrence to validate their bearish significance.
Final Assessment: The current outlook for AERGO/USDT is neutral to bearish. While there are hints of short-term bullish movements, the overall trend, as reflected by the alignment of moving averages, and the lack of sustained higher volume signals, points towards a continuation of the downtrend. The price action currently consolidates around resistance levels and there is less decisive buying to indicate a strong reversal. Any bullish movements would require confirmation with increasing volume and a decisive break above resistance levels and a test of the support levels identified, to truly flip the trend. The general trend suggests a downtrend is still likely pending a significant volume-driven reversal.