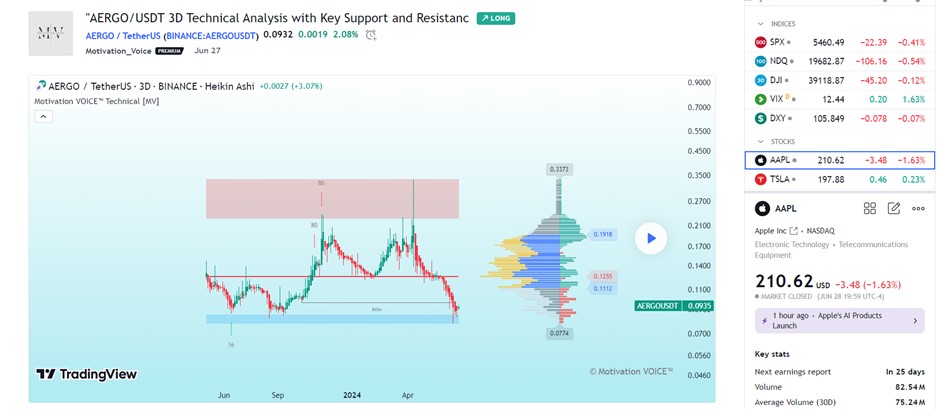
The imag is a technical analysis chart of AERGO/USDT on a 3-day time frame, using Heikin Ashi candles. Here are some key elements identified in the chart:
1. **Price Levels**:
– The current price is at 0.0936 USDT.
– Resistance levels at approximately 0.3373 USDT, 0.1918 USDT, and 0.1255 USDT.
– Support levels at approximately 0.1112 USDT and 0.0774 USDT.
2. **Volume Profile**:
– The volume profile on the right side shows high trading activity around 0.1918 USDT and 0.1255 USDT, indicating these levels might act as significant resistance.
– There is also notable trading activity around 0.1112 USDT and 0.0774 USDT, which might act as support.
3. **Historical Price Movements**:
– The chart shows a significant drop from around 0.3373 USDT to the current price level.
– The highest recent peak was around 0.3373 USDT.
4. **Technical Indicators**:
– The chart shows a “BOS” level, likely indicating a Break of Structure around the 0.080 USDT level.
– The range between 0.080 USDT and 0.086 USDT is highlighted, possibly indicating a consolidation or a previous key level.